

Proportionality vs utility: Droop quota and feasible points

I added a method to determine the feasible regions of proportionality vs
VSE for methods that elect from certain sets, to my simulator.
This works by taking the convex hull of the boundary of the set so far,
and then creating a set of new points by, for each convex hull point,
and for each possible outcome inside the set for that round, adding the
proportionality and utility values for that outcome to that convex hull
point. Doing so produces a new point set, and the convex hull is set to
the convex hull of the new point set.
As long as the model space isn't too small,[1] the convex hull should
then characterize the region of every nondeterministic method that could
be designed that elects from the set in question.
By using the set of all outcomes (all possible councils), the region
shows what tradeoffs are possible. Every point outside the region is
infeasible - it's impossible to make a method that good (or that bad).
By using the set of every outcome compatible with the Droop
proportionality criterion, the region shows what results a method that
passes the DPC can get. And at least for this model, it's surprisingly
large: the Droop proportionality criterion doesn't seem to be a very
strong constraint.
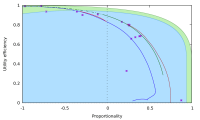
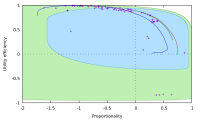
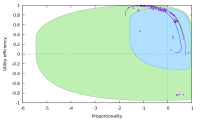
I've added some graphs showing these regions for the same parameters as
in my previous post. Getting gnuplot to work properly is kind of a pain,
so excuse the lower effective resolution (thicker lines). The blue
region is for methods passing the Droop proportionality criterion, while
the green is what's feasible at all. (The white areas are impossible to
reach.)
-km
[1] For the technical details, the convexity only approximately holds.
Suppose we have a model where there are only two possible elections,
call them eA and eB, and two candidates (A and B). Sometimes, electing A
in eA is the best, other times, electing B in eA is the best; and the
same for eB.
If we only consider deterministic methods, then disregarding ties, there
are only four possibilities:
method W: elect A in eA, B in eB
method X: elect A in eA, A in eB
method Y: elect B in eA, A in eB
method Z: elect B in eA, B in eB.
Suppose these are at the edges of the chart, i.e. these solutions
correspond to (-1, -1) for W, (1, -1) for X, (1, -1) for Y, and (1, 1)
for Z. There's no way to get, say (0, 0), although this is a convex
combination of the four possible outcomes. But it is possible if we're
nondeterministic: then a method that behaves like W 50% of the time and
Z the other 50% of the time would have an expected result of (0, 0).
But if the model is very small (there are few elections), then what can
happen is that the edges are too optimistic. In the example above, every
time an eA election favors A, the convex hull will be updated with
(among others) the results of a method that somehow guesses A; and every
time it favors B, the convex hull will be updated with (among others)
one that guesses B. So it not only contains nondeterministic methods,
but "improbably lucky" ones.
If the model's election space is large, then the chance that the same
election will occur more than once during a simulation should be small
enough that this shouldn't be a problem. Since the binary model has
5..260 voters, I don't think this "improbably lucky" scenario is going
to be a problem... but I might just add a test for elections that have
been seen in the past, just to be sure, later.

On Wed, Sep 11, 2024 at 1:45 PM Kristofer Munsterhjelm <
km-elmet@munsterhjelm.no> wrote:
By using the set of every outcome compatible with the Droop
proportionality criterion, the region shows what results a method that
passes the DPC can get. And at least for this model, it's surprisingly
large: the Droop proportionality criterion doesn't seem to be a very
strong constraint.
Doesn't surprise me :) I've been pointing out that PSC is an extremely weak
condition for a while now. It's only slightly stronger than
color-proportionality is.
I'd also point out the space in the top-right, which shows either our
definition of "proportionality" or "utility" is wrong, or Droop-PSC is
wrong, because there are Pareto improvements on this graph ruled out by
Droop-PSC. I'd probably go with both.
Droop-PSC guarantees disproportional representation overall, because as
I've mentioned before, the Droop quota is the most-biased possible quota
(it is maximally friendly to large parties; any rule more friendly to them
would no longer count as proportional). I'm not 100% sure, but IIRC Webster
satisfies the k-1 quota rule (which has no common name that I know of).
This makes me think that if we did want to enforce PSC, (k-1)-PSC would
be a more sensible rule of proportionality. It also lines up quite well
with the "proportionality up to one object" constraint that's common for
fair division.
On the topic: I think if we ever find ourselves tempted to make a tradeoff
between something we're calling "utility" and some other quantity, we've
defined utility incorrectly. Specifically, I doubt voters' utilities are
equal to the sum of scores they assign to each candidate. Unlike in the
single-winner case, I'm not sure how we can interpret the ratings voters
assign to each candidate. If scores were actually linear and additive, that
would imply colored voters care just as much about going from 49% of seats
for their party up to 51% as they do about going from 97% to 99%.

The problem is that we can't objectively determine utilities from the scores. We can only make models that make assumptions. I don't think using total score in the trade-off is necessarily bad a thing because it's something we can easily objectively measure; I just don't think it's correct to call it "utility".
Toby
On Saturday 14 September 2024 at 22:39:48 BST, Closed Limelike Curves closed.limelike.curves@gmail.com wrote:
On the topic: I think if we ever find ourselves tempted to make a tradeoff between something we're calling "utility" and some other quantity, we've defined utility incorrectly. Specifically, I doubt voters' utilities are equal to the sum of scores they assign to each candidate. Unlike in the single-winner case, I'm not sure how we can interpret the ratings voters assign to each candidate. If scores were actually linear and additive, that would imply colored voters care just as much about going from 49% of seats for their party up to 51% as they do about going from 97% to 99%.
Election-Methods mailing list - see https://electorama.com/em for list info
Yeah, agreed. Mostly what I'm saying is I'd like us to come up with some
model+meaning for these scores first, then use that model to work out how
to combine them best.
On Sat, Sep 14, 2024 at 2:47 PM Toby Pereira tdp201b@yahoo.co.uk wrote:
The problem is that we can't objectively determine utilities from the
scores. We can only make models that make assumptions. I don't think using
total score in the trade-off is necessarily bad a thing because it's
something we can easily objectively measure; I just don't think it's
correct to call it "utility".
Toby
On Saturday 14 September 2024 at 22:39:48 BST, Closed Limelike Curves <
closed.limelike.curves@gmail.com> wrote:
On the topic: I think if we ever find ourselves tempted to make a tradeoff
between something we're calling "utility" and some other quantity, we've
defined utility incorrectly. Specifically, I doubt voters' utilities are
equal to the sum of scores they assign to each candidate. Unlike in the
single-winner case, I'm not sure how we can interpret the ratings voters
assign to each candidate. If scores were actually linear and additive, that
would imply colored voters care just as much about going from 49% of seats
for their party up to 51% as they do about going from 97% to 99%.
Election-Methods mailing list - see https://electorama.com/em for list
info
On 2024-09-14 23:47, Toby Pereira wrote:
The problem is that we can't objectively determine utilities from the
scores. We can only make models that make assumptions. I don't think
using total score in the trade-off is necessarily bad a thing because
it's something we can easily objectively measure; I just don't think
it's correct to call it "utility".
Every model relies on some assumptions. Even the ordinary sort of VSE
that puts Range on top assumes that the quality of the winner can be
based on the sum of the voters' utilities (as opposed to, say, Rawlsian
leximin), and that temporal effects don't matter.
That said, I'm not terribly wedded to the term. My first thought was
"majoritarian satisfaction", but it's not really majoritarian.
This "utility" has the property that, assuming the validity of its
single-winner version, a method that has more of it with the same
proportionality is better, and a method that has more proportionality
with the same "utility" is also better. It thus necessarily reduces to
ordinary VSE in the single-winner case. Whatever term we come up with
for it should capture this, and ideally be relatively short too.
The reason I first chose this as one of the axes is that it's obviously
in tension with proportionality, and that the two axes reflect the
spread of possible solutions between "have a lot of individually good
winners who everybody likes" and "specialize by having some winners who
appeal to some people, others appealing to others" that comes with PR.
Somewhere on this tradeoff curve there's an optimum, but I suspect that
the location of that optimum depends on a bunch of parameters we don't
know. It's possible to argue reasonably for single-winner districts
filled with something like Condorcet (or Range if you're a cardinal
guy); and it's possible to argue reasonably for proportional
representation and the specialization that comes with it. See e.g.
https://betterchoices.vote/ for the former and
https://protectdemocracy.org/work/can-proportional-representation-create-better-governance/
for the latter.[1]
If we don't know the optimum, the best we can do is provide a
high-quality method with a tunable parameter that decides the "utility"
vs proportionality tradeoff. Choose-one party list PR isn't it: due to
Plurality's vote-splitting problems, going from Sainte-Laguë to D'Hondt
doesn't give more power to centrists who could break problematic
kingmaker scenarios, it just gives more power to the large-bloc parties.
-km
[1] Furthermore, I suspect that even if we could gather all the data
for the parameters to determine the optimum, the resulting process would
be very opaque, which is a problem in itself.