

Proportionality vs utility: redoing 2008 with better units

I've been incorporating some very old code for multiwinner method
testing (see my very first post) into Quadelect, my general purpose
voting program. And I've run some simulations and got an indication of
what different multiwinner methods prioritize between proportionality
and broad support. So I thought I'd write a post about the results.
The code tests the proportionality and utilitarian quality of a winner
set in a similar way to the VSE-like proportionality measure I posted
about on July 31. It just uses binary issues instead of a normal spatial
distribution.
That is, each voter has a binary position on one of a set number of
issues. Each voter's utility for a given candidate being elected is the
number of issues where they agree.
The program determines proportionality by checking the similarity of the
proportion of elected candidates who hold a yes position on each issue,
with the proportion of the voters who do so. It quantifies the
difference by using a proportionality measure like the Sainte-Laguë
index. So far, just a copy of my approach in 2008 (it's the same code,
after all).
But instead of the somewhat on-the-spot approach to combining the
utility and disproportionality results, it uses VSE. This gives what
seems to me to be more sensible results.
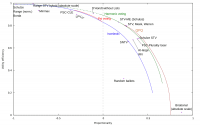
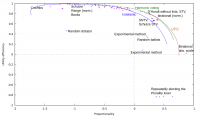
I've attached the results as pictures. The distribution parameters are:
Number of voters per round: 5 ... 260
Number of candidates: 5 ... 11
Number of issue dimensions: 1 ... 11
Number of winners: 3 ... 10,
and I'm using the Sainte-Laguë index as error measure.
The VSE zero points are anchored to the expected value
(disproportionality and utility) of just picking candidates at random
until the council is full. The vertical black dotted line on the detail
plot thus separates methods that are more proportional than random
candidate from those that are less.
Each purple dot (plus sign) corresponds to one method. Some methods take
parameters that adjust their proportionality, e.g. most of Warren's
cardinal methods take a D'Hondt-Sainte-Laguë adjustment parameter. Those
are represented by curves which sweep either over the full range or a
large area of it. (Since Harmonic voting is relatively good; I've run it
outside its usual range to see what happens. The results for the
out-of-range values are marked with a dashed line.)
Clearly there's a trade-off between proportionality and utilitarian
efficiency. That's not very surprising, because if you have a large
number of winners, proportionality tells you that you should elect one
representative for each major issue position, but VSE tells you that you
should fill the council with candidates close to the median voter.
But other things are more surprising. One is just how weak the Droop
proportionality criterion constraint is. Both PSC-CLE and PSC-(Plurality
loser) pass it, but they're quite far from each other on the plot.
Second, there doesn't seem to be any "cardinal superiority" here.
Harmonic is the best cardinal method of those tested, and it intersects
STV pretty cleanly. The concentrated nature (and comparatively lower
performance) of Psi voting compared to Harmonic is also pretty surprising.
At first I didn't expect Schulze STV to be more proportional than
ordinary STV; for Schulze vs IRV it's the other way around. But my
Kemeny clustering methods (not shown here as they're far too slow) also
fall much more on the proportional than utilitarian side of things. Pure
Condorcet-based multiwinner methods might just be particularly good at
identifying the nth quantile candidates, the way Condorcet does the
median candidate; if so, such nth quantile candidates would be
proportionality-focused rather than utility-focused.
But on the left side of the detail plot, why is minmax so far off
Schulze? They're based on the same logic, after all.
Some of the names may be unfamiliar, so here are some references:
- Random dictator: strategyproof, elect the first k candidates listed on
a random voter's ballot. - D'Hondt without Lists: a method by Juho Laatu.
http://lists.electorama.com/pipermail/election-methods-electorama.com/2008-October/121082.html
My variant multiplies the quotients (1/2, 1/3 etc), as mentioned in that
post, instead of adding them. - Coombs, Borda, etc: these are all bloc voting: elect the k highest
scoring candidates. - Random ballots: this is also strategyproof (I think?). Pick a voter at
random, elect the voter's first preference, eliminate that candidate
from every ballot, remove the lucky voter's ballot, and repeat. - Harmonic voting, Psi voting: see
https://rangevoting.org/QualityMulti.html. - QPQ: Quota-preferential by Quotient, a method by Woodall.
https://www.votingmatters.org.uk/ISSUE17/INDEX.HTM - Birational, LPV0+: Cardinal methods proposed by Forest and Warren. See
https://rangevoting.org/WarrenSmithPages/homepage/multisurv.pdf. Ratings
are counted as fractional approval votes. - Isoelastic: Cardinal method based on a function proposed by Peter
Zbornik.
http://lists.electorama.com/pipermail/election-methods-electorama.com/2010-May/124448.html
-km
On 2024-09-09 22:15, Kristofer Munsterhjelm wrote:
I've been incorporating some very old code for multiwinner method
testing (see my very first post) into Quadelect, my general purpose
voting program. And I've run some simulations and got an indication of
what different multiwinner methods prioritize between proportionality
and broad support. So I thought I'd write a post about the results.
I see now that I put the "D'Hondt without Lists" and "Birational (norm)"
text on the full chart in the wrong spot. The detailed chart gives the
right position - they're all on the left side of the random candidate line.
Prop'ty Util.
-0.10956 0.90776 DHwL(Schulze(wv))
-0.08229 0.90724 DHwL(Ext-Minmin(margins))
-0.07524 0.87113 DHwL(Ext-Minmax(margins))
-0.06104 0.89726 Cardinal: R-Birational
-km

Kristofer
This is very interesting. Thank you for doing this analysis. Random ballots, as I understand your implementation, I think would not be strategyproof. If there are c candidates to be elected, then every voter ranks their top c. And then you sequentially pick c ballots at random, electing the top-ranked unelected candidate on each ballot. Is that correct? In that case, I think if a voter is fairly confident that their favourite candidate will be elected anyway, it makes sense for them to put other candidates above them that might not get elected anyway. If my second favourite candidate is not very popular among other voters, and my favourite is, I am likely to put my second favourite top.
Another lottery method you might want to consider is COWPEA Lottery. This uses approval ballots. For each candidate to be elected, ballots are selected at random to act as tie-breaks. At first, every candidate is in the running. Pick a ballot, and then only those approved on that ballot are still in the running and so on, until one is left. If a ballot reduces the number of candidates in the running to zero, it is ignored. This method can also be used with the KP-transformation for a score voting variant (like the relationship of PAV to harmonic voting).
Toby
On Monday 9 September 2024 at 21:15:32 BST, Kristofer Munsterhjelm <km-elmet@munsterhjelm.no> wrote:
I've been incorporating some very old code for multiwinner method
testing (see my very first post) into Quadelect, my general purpose
voting program. And I've run some simulations and got an indication of
what different multiwinner methods prioritize between proportionality
and broad support. So I thought I'd write a post about the results.
The code tests the proportionality and utilitarian quality of a winner
set in a similar way to the VSE-like proportionality measure I posted
about on July 31. It just uses binary issues instead of a normal spatial
distribution.
That is, each voter has a binary position on one of a set number of
issues. Each voter's utility for a given candidate being elected is the
number of issues where they agree.
The program determines proportionality by checking the similarity of the
proportion of elected candidates who hold a yes position on each issue,
with the proportion of the voters who do so. It quantifies the
difference by using a proportionality measure like the Sainte-Laguë
index. So far, just a copy of my approach in 2008 (it's the same code,
after all).
But instead of the somewhat on-the-spot approach to combining the
utility and disproportionality results, it uses VSE. This gives what
seems to me to be more sensible results.
I've attached the results as pictures. The distribution parameters are:
Number of voters per round: 5 ... 260
Number of candidates: 5 ... 11
Number of issue dimensions: 1 ... 11
Number of winners: 3 ... 10,
and I'm using the Sainte-Laguë index as error measure.
The VSE zero points are anchored to the expected value
(disproportionality and utility) of just picking candidates at random
until the council is full. The vertical black dotted line on the detail
plot thus separates methods that are more proportional than random
candidate from those that are less.
Each purple dot (plus sign) corresponds to one method. Some methods take
parameters that adjust their proportionality, e.g. most of Warren's
cardinal methods take a D'Hondt-Sainte-Laguë adjustment parameter. Those
are represented by curves which sweep either over the full range or a
large area of it. (Since Harmonic voting is relatively good; I've run it
outside its usual range to see what happens. The results for the
out-of-range values are marked with a dashed line.)
Clearly there's a trade-off between proportionality and utilitarian
efficiency. That's not very surprising, because if you have a large
number of winners, proportionality tells you that you should elect one
representative for each major issue position, but VSE tells you that you
should fill the council with candidates close to the median voter.
But other things are more surprising. One is just how weak the Droop
proportionality criterion constraint is. Both PSC-CLE and PSC-(Plurality
loser) pass it, but they're quite far from each other on the plot.
Second, there doesn't seem to be any "cardinal superiority" here.
Harmonic is the best cardinal method of those tested, and it intersects
STV pretty cleanly. The concentrated nature (and comparatively lower
performance) of Psi voting compared to Harmonic is also pretty surprising.
At first I didn't expect Schulze STV to be more proportional than
ordinary STV; for Schulze vs IRV it's the other way around. But my
Kemeny clustering methods (not shown here as they're far too slow) also
fall much more on the proportional than utilitarian side of things. Pure
Condorcet-based multiwinner methods might just be particularly good at
identifying the nth quantile candidates, the way Condorcet does the
median candidate; if so, such nth quantile candidates would be
proportionality-focused rather than utility-focused.
But on the left side of the detail plot, why is minmax so far off
Schulze? They're based on the same logic, after all.
Some of the names may be unfamiliar, so here are some references:
- Random dictator: strategyproof, elect the first k candidates listed on
a random voter's ballot. - D'Hondt without Lists: a method by Juho Laatu.
http://lists.electorama.com/pipermail/election-methods-electorama.com/2008-October/121082.html
My variant multiplies the quotients (1/2, 1/3 etc), as mentioned in that
post, instead of adding them. - Coombs, Borda, etc: these are all bloc voting: elect the k highest
scoring candidates. - Random ballots: this is also strategyproof (I think?). Pick a voter at
random, elect the voter's first preference, eliminate that candidate
from every ballot, remove the lucky voter's ballot, and repeat. - Harmonic voting, Psi voting: see
https://rangevoting.org/QualityMulti.html. - QPQ: Quota-preferential by Quotient, a method by Woodall.
https://www.votingmatters.org.uk/ISSUE17/INDEX.HTM - Birational, LPV0+: Cardinal methods proposed by Forest and Warren. See
https://rangevoting.org/WarrenSmithPages/homepage/multisurv.pdf. Ratings
are counted as fractional approval votes. - Isoelastic: Cardinal method based on a function proposed by Peter
Zbornik.
http://lists.electorama.com/pipermail/election-methods-electorama.com/2010-May/124448.html
-km----
Election-Methods mailing list - see https://electorama.com/em for list info
On 2024-09-10 14:21, Toby Pereira wrote:
Kristofer
This is very interesting. Thank you for doing this analysis.
That's good to hear :-) Often I feel like nothing happens when I post.
It's good to know that people appreciate my posts.
Random ballots, as I understand your implementation, I think would
not be strategyproof. If there are c candidates to be elected, then
every voter ranks their top c. And then you sequentially pick c
ballots at random, electing the top-ranked unelected candidate on
each ballot. Is that correct? In that case, I think if a voter is
fairly confident that their favourite candidate will be elected
anyway, it makes sense for them to put other candidates above them
that might not get elected anyway. If my second favourite candidate
is not very popular among other voters, and my favourite is, I am
likely to put my second favourite top.
That's a good point. I guess PR methods almost always come with an
incentive for vote management. It would be interesting to find out just
how hard the implication is: how PR you can make a method and not have
vote management, or how proportional you can make a strategyproof method.
Another lottery method you might want to consider is COWPEA Lottery.
This uses approval ballots. For each candidate to be elected, ballots
are selected at random to act as tie-breaks. At first, every candidate
is in the running. Pick a ballot, and then only those approved on that
ballot are still in the running and so on, until one is left. If a
ballot reduces the number of candidates in the running to zero, it is
ignored. This method can also be used with the KP-transformation for a
score voting variant (like the relationship of PAV to harmonic voting).
I haven't run any approval type methods yet because that depends on just
how the voters render their preferences into Approval. But KPT should be
doable. I'd also like to implement the Phragmen family and Monroe, and
some ideas I have for a proportional (sequential) adjustable PR method
that reduces to single-winner Condorcet.
Other methods that would be nice to implement are CPO-STV, Forest's
CFPRM ("Condorcet-flavored PR method"), and CIVS' PR method.
So I have no difficulties finding out things that I could do. It's doing
them that's the hard part :-)
-km
I have another couple of questions. You said that the zero points are what you'd get by picking candidates at random. But does this not depend on how the candidates are distributed? Are they just uniformly spread across the voting space? How did repeatedly electing the plurality loser end up so proportional? Also would it be possible to post the result as the raw numbers in addition to the graph?
Thanks
Toby
On Tuesday 10 September 2024 at 21:32:33 BST, Kristofer Munsterhjelm km-elmet@munsterhjelm.no wrote:
On 2024-09-10 14:21, Toby Pereira wrote:
Kristofer
This is very interesting. Thank you for doing this analysis.
That's good to hear :-) Often I feel like nothing happens when I post.
It's good to know that people appreciate my posts.
Random ballots, as I understand your implementation, I think would
not be strategyproof. If there are c candidates to be elected, then
every voter ranks their top c. And then you sequentially pick c
ballots at random, electing the top-ranked unelected candidate on
each ballot. Is that correct? In that case, I think if a voter is
fairly confident that their favourite candidate will be elected
anyway, it makes sense for them to put other candidates above them
that might not get elected anyway. If my second favourite candidate
is not very popular among other voters, and my favourite is, I am
likely to put my second favourite top.
That's a good point. I guess PR methods almost always come with an
incentive for vote management. It would be interesting to find out just
how hard the implication is: how PR you can make a method and not have
vote management, or how proportional you can make a strategyproof method.
Another lottery method you might want to consider is COWPEA Lottery.
This uses approval ballots. For each candidate to be elected, ballots
are selected at random to act as tie-breaks. At first, every candidate
is in the running. Pick a ballot, and then only those approved on that
ballot are still in the running and so on, until one is left. If a
ballot reduces the number of candidates in the running to zero, it is
ignored. This method can also be used with the KP-transformation for a
score voting variant (like the relationship of PAV to harmonic voting).
I haven't run any approval type methods yet because that depends on just
how the voters render their preferences into Approval. But KPT should be
doable. I'd also like to implement the Phragmen family and Monroe, and
some ideas I have for a proportional (sequential) adjustable PR method
that reduces to single-winner Condorcet.
Other methods that would be nice to implement are CPO-STV, Forest's
CFPRM ("Condorcet-flavored PR method"), and CIVS' PR method.
So I have no difficulties finding out things that I could do. It's doing
them that's the hard part :-)
-km
On 2024-09-11 14:32, Toby Pereira wrote:
I have another couple of questions. You said that the zero points are
what you'd get by picking candidates at random. But does this not depend
on how the candidates are distributed?
Yes, that's right. All the results depend on the model, which currently
is a very simple binary one.
Are they just uniformly spread across the voting space?
This is how the model works:
Let n be the number of issues for the issue space for this round. First
draw n random uniform numbers for where the ith number is how likely a
random voter is to hold the "yes" opinion on the ith issue. Call this
the bias vector.
Then assign the voters their issues by flipping biased coins, where the
bias is given by the bias vector.
Calculate the correct proportions of yes opinions across all the voters
and update the bias vector. Since the second step is random, we'll
hardly ever get an exact match to the bias vector proportions from the
first step. The bias vector needs to reflect the proportion of voters
who actually hold the yes position for proportionality calculations to work.
The first k voters are candidates, so the voters and candidates come
from the same distribution. This also means that the candidates
paricipate in the election too.
Random candidate just picks these k candidates at random. They're not
uniformly spread across the voting space since their yes/no opinions are
influenced by the bias vector just like the voters' are.
Each voter rates each candidate according to their Hamming distance,
i.e. number of points equals number of issues that they agree upon, plus
some small amount of noise.
How did repeatedly electing the plurality loser end up so
proportional?
I was thinking the reason was something like: if the opinion space is
flat (i.e. some issues are liked by some voters, others are liked by
other voters, with little correlation), then if you were to repeatedly
elect someone hated by a polarizing method, you would be electing
favorites of the "other camp".
But it turned out that wasn't actually the case. What I had called
"Worst Plurality" (electing the Plurality loser) was in fact worst
Antiplurality (electing the Antiplurality loser). And I suppose that
since Antiplurality has high VSE awful proportionality, reflecting it
got something that had proportionality but not utility.
That's why review is so important: it helps identify slip-ups and bugs.
Thanks for prompting me to investigate this.
With the bug fixed, I get the following results after 900 rounds, same
parameters:
Prop'ty Utility
-1.0518 -0.64366 Worst Plurality
0.36886 -0.86348 Worst Antiplurality
which makes a lot more sense. (They'll be slightly off compared to the
attached results since I didn't run more rounds, but the quadrants are a
lot more sensible.)
I'm not entirely sure why "elect the loser" flips the sign on both
proportionality and utility, though. You'd expect proportionality to be
more fragile and thus show bad results (VSE < 0) if you go around
electing hated candidates... but apparently not.
Also would it be possible to post the result as the raw numbers in addition to the graph?
Sure. I've attached the following files:
harmonic.txt: Harmonic voting with different delta values
harmonic_extended.txt: Harmonic voting with delta > 1 (dashed line on graph)
isoelastic.txt: Isoelastic
psi.txt: Psi voting
qpq.txt: QPQ
others.txt: Other methods, for the full graph
selected.txt: Selected methods for the detailed graph
These are with 377k rounds.
I've marked the mistakenly thought to be Plurality loser results #Worst
Antiplurality#, to show that they're really electing Antiplurality losers.
The names in others.txt in particular require some explanation:
Method names containing a question mark have been imported more or less
directly from my old source; I have not fully checked them for bugs.
Maj[base]: Majoritarian/bloc voting using the "base" method. This just
elects the winner, second place, third place, etc. according the base
method.
Maj[Eliminate[base]]: Bloc voting using sequential loser elimination
with "base" as the base method. E.g. Eliminate[Plurality] is IRV,
Eliminate[Antiplurality] is Coombs.
Maj[AVGEliminate[base]]: As above, but eliminates every candidate with
below-average score for the round. Maj[AVGEliminate[Plurality]] is Craig
Carey's IFPP.
Cardinal-20: Range voting with a 0...20 scale. Absolute scale.
Cardinal-20(norm): Same, but normalized scale.
Ext-Minmin: the "max A>B" method: the winner is the one with the
greatest pairwise defeat over someone else.
ReweightA[positional method]: Like reweighted Range voting, but using
the positional method's points instead of ratings. Each voter's weight
is adjusted to be C / (C + Q), where Q is the sum of contributions to
elected candidates, with each contribution normalized so that maximum
number of points is mapped to 1, and minimum to 0; and C is an
adjustable parameter.
ReweightM[positional method]: When someone is elected, each voter's
current weight is multiplied by C / (C + Q), where Q is the sum of
contributions to that candidate.
Range-Auction, Q-Range STV, Linear Range STV, Quota Bucklin, Set PR
Bucklin, Compat-QLTD-PR, M-Set Webster: methods from my 2008 simulator;
I'm not quite sure how they work; they thus need more investigation. Of
these, only the Range STV versions and M-Set Webster seem to be good,
and I can probably throw out the rest unless other simulations show them
to be good.
DHwL[base]: D'Hondt without lists. The base method is used to pick the
next winner according to the modified pairwise matrix.
PSC-CLE: https://electowiki.org/wiki/PSC-CLE. "Quota = x" uses the quota
(num voters)/(num seats + x) instead of the Droop quota.
C-Elim[base]: As PSC-CLE, but using the base method's elimination order.
PSC-CLE is C-Elim[Schulze].
STV-ME (base): Generalization of BTR-IRV. Let N = (number of seats -
number already elected) + 1. When a candidate needs to be eliminated,
conduct an election between the N candidates with the least first
preference count, using the base method. Eliminate the loser of this
election. Note that STV-ME (Plurality) is not the same thing as plain STV.
R-Birational: Birational with a relative scale. (Just "birational" uses
an absolute scale.)
For positional methods, ER means equal-rank is counted whole, but this
rarely comes into play due to the noise being added to voters' ratings.
/fd means "first differences", i.e. ties for elimination are broken by
the first round where the candidates were not tied.
-km
On 2024-09-11 17:32, Kristofer Munsterhjelm wrote:
Random candidate just picks these k candidates at random. They're not
uniformly spread across the voting space since their yes/no opinions are
influenced by the bias vector just like the voters' are.
Just picks from these k candidates at random, that is. It picks s of
the candidates at random without replacement, where s is the number of
seats.
-km
Thanks again for producing all this. One thing I've just realised is that according to this metric, harmonic (and psi) voting continue to get more proportional as you go from D'Hondt to Sainte-Laguë and pass out the other side. Could this be a failing of the metric? Surely it should peak with Sainte-Laguë.
I'm also surprised at how much worse psi voting seems to perform than harmonic voting (which you mentioned). I would have expected harmonic to be better, but not by that much. I always told Warren that Reweighted Range Voting would be better with the KP-transformation though!
Toby
On Wednesday 11 September 2024 at 16:32:45 BST, Kristofer Munsterhjelm km-elmet@munsterhjelm.no wrote:
On 2024-09-11 14:32, Toby Pereira wrote:
I have another couple of questions. You said that the zero points are
what you'd get by picking candidates at random. But does this not depend
on how the candidates are distributed?
Yes, that's right. All the results depend on the model, which currently
is a very simple binary one.
Are they just uniformly spread across the voting space?
This is how the model works:
Let n be the number of issues for the issue space for this round. First
draw n random uniform numbers for where the ith number is how likely a
random voter is to hold the "yes" opinion on the ith issue. Call this
the bias vector.
Then assign the voters their issues by flipping biased coins, where the
bias is given by the bias vector.
Calculate the correct proportions of yes opinions across all the voters
and update the bias vector. Since the second step is random, we'll
hardly ever get an exact match to the bias vector proportions from the
first step. The bias vector needs to reflect the proportion of voters
who actually hold the yes position for proportionality calculations to work.
The first k voters are candidates, so the voters and candidates come
from the same distribution. This also means that the candidates
paricipate in the election too.
Random candidate just picks these k candidates at random. They're not
uniformly spread across the voting space since their yes/no opinions are
influenced by the bias vector just like the voters' are.
Each voter rates each candidate according to their Hamming distance,
i.e. number of points equals number of issues that they agree upon, plus
some small amount of noise.
How did repeatedly electing the plurality loser end up so
proportional?
I was thinking the reason was something like: if the opinion space is
flat (i.e. some issues are liked by some voters, others are liked by
other voters, with little correlation), then if you were to repeatedly
elect someone hated by a polarizing method, you would be electing
favorites of the "other camp".
But it turned out that wasn't actually the case. What I had called
"Worst Plurality" (electing the Plurality loser) was in fact worst
Antiplurality (electing the Antiplurality loser). And I suppose that
since Antiplurality has high VSE awful proportionality, reflecting it
got something that had proportionality but not utility.
That's why review is so important: it helps identify slip-ups and bugs.
Thanks for prompting me to investigate this.
With the bug fixed, I get the following results after 900 rounds, same
parameters:
Prop'ty Utility
-1.0518 -0.64366 Worst Plurality
0.36886 -0.86348 Worst Antiplurality
which makes a lot more sense. (They'll be slightly off compared to the
attached results since I didn't run more rounds, but the quadrants are a
lot more sensible.)
I'm not entirely sure why "elect the loser" flips the sign on both
proportionality and utility, though. You'd expect proportionality to be
more fragile and thus show bad results (VSE < 0) if you go around
electing hated candidates... but apparently not.
Also would it be possible to post the result as the raw numbers in addition to the graph?
Sure. I've attached the following files:
harmonic.txt: Harmonic voting with different delta values
harmonic_extended.txt: Harmonic voting with delta > 1 (dashed line on graph)
isoelastic.txt: Isoelastic
psi.txt: Psi voting
qpq.txt: QPQ
others.txt: Other methods, for the full graph
selected.txt: Selected methods for the detailed graph
These are with 377k rounds.
I've marked the mistakenly thought to be Plurality loser results #Worst
Antiplurality#, to show that they're really electing Antiplurality losers.
The names in others.txt in particular require some explanation:
Method names containing a question mark have been imported more or less
directly from my old source; I have not fully checked them for bugs.
Maj[base]: Majoritarian/bloc voting using the "base" method. This just
elects the winner, second place, third place, etc. according the base
method.
Maj[Eliminate[base]]: Bloc voting using sequential loser elimination
with "base" as the base method. E.g. Eliminate[Plurality] is IRV,
Eliminate[Antiplurality] is Coombs.
Maj[AVGEliminate[base]]: As above, but eliminates every candidate with
below-average score for the round. Maj[AVGEliminate[Plurality]] is Craig
Carey's IFPP.
Cardinal-20: Range voting with a 0...20 scale. Absolute scale.
Cardinal-20(norm): Same, but normalized scale.
Ext-Minmin: the "max A>B" method: the winner is the one with the
greatest pairwise defeat over someone else.
ReweightA[positional method]: Like reweighted Range voting, but using
the positional method's points instead of ratings. Each voter's weight
is adjusted to be C / (C + Q), where Q is the sum of contributions to
elected candidates, with each contribution normalized so that maximum
number of points is mapped to 1, and minimum to 0; and C is an
adjustable parameter.
ReweightM[positional method]: When someone is elected, each voter's
current weight is multiplied by C / (C + Q), where Q is the sum of
contributions to that candidate.
Range-Auction, Q-Range STV, Linear Range STV, Quota Bucklin, Set PR
Bucklin, Compat-QLTD-PR, M-Set Webster: methods from my 2008 simulator;
I'm not quite sure how they work; they thus need more investigation. Of
these, only the Range STV versions and M-Set Webster seem to be good,
and I can probably throw out the rest unless other simulations show them
to be good.
DHwL[base]: D'Hondt without lists. The base method is used to pick the
next winner according to the modified pairwise matrix.
PSC-CLE: https://electowiki.org/wiki/PSC-CLE. "Quota = x" uses the quota
(num voters)/(num seats + x) instead of the Droop quota.
C-Elim[base]: As PSC-CLE, but using the base method's elimination order.
PSC-CLE is C-Elim[Schulze].
STV-ME (base): Generalization of BTR-IRV. Let N = (number of seats -
number already elected) + 1. When a candidate needs to be eliminated,
conduct an election between the N candidates with the least first
preference count, using the base method. Eliminate the loser of this
election. Note that STV-ME (Plurality) is not the same thing as plain STV.
R-Birational: Birational with a relative scale. (Just "birational" uses
an absolute scale.)
For positional methods, ER means equal-rank is counted whole, but this
rarely comes into play due to the noise being added to voters' ratings.
/fd means "first differences", i.e. ties for elimination are broken by
the first round where the candidates were not tied.
-km
On 2024-09-12 14:33, Toby Pereira wrote:
Thanks again for producing all this. One thing I've just realised is
that according to this metric, harmonic (and psi) voting continue to get
more proportional as you go from D'Hondt to Sainte-Laguë and pass out
the other side. Could this be a failing of the metric? Surely it should
peak with Sainte-Laguë.
That's a good point, too. I was meaning to add support for party list
methods, which would return a number of seats per party. This would be a
good reason to do it; I could then test it with the simple party list
case and see whether the SLI maximizes proportionality when each issue
space dimension corresponds to a different party.
-km
On 2024-09-12 14:33, Toby Pereira wrote:
Thanks again for producing all this. One thing I've just realised is
that according to this metric, harmonic (and psi) voting continue to get
more proportional as you go from D'Hondt to Sainte-Laguë and pass out
the other side. Could this be a failing of the metric? Surely it should
peak with Sainte-Laguë.
Just an update on this: I had the arguments to the Sainte-Laguë index
function the wrong way around. (Unlike the Euclidean distance, order
matters.) I fixed it and now QPQ's proportionality optimum is at 0.3
instead of 0, and Harmonic's at 0.1 instead of 0.
As a side effect, a lot of the negative proportionality results
(Antiplurality etc.) vanished. The reasonable single-winner bloc methods
all register as having some proportionality relative to random
candidate. And both worst Plurality and worst Antiplurality (electing
the losers of the respective methods) score badly on proportionality
now. So the results seem to be more sensible.
I wrote another implementation from scratch for Harmonic and the
proportionality peaked below delta=0.5 there too, so I'm leaning towards
the problem either being inherent to the model or a result of Harmonic
depending too much on the rating, though it could also be an improper
generalization of the disproportionality index.[1]
The latter argument would go like: Suppose that with some overlapping
opinions, the ratings come out the same was as if there were fewer
issues and the voters were less fragmented, and they were rating the
candidates on quality instead. Then delta=1/2 would choose a balanced
outcome for this lower dimension case, but it would be too large-issue
biased in the higher dimension case.
Such an ambiguity might even be fundamental: that no method can tell
them apart. If the model is unrealistic, that's not a problem, but if it
is, that would mean that the space-unbiased parameter depends on the
complexity of the issue space itself, which would be a bummer.
In a sense, even simpler settings have this, e.g. Warren's "0.5 is not
the optimum divisor" (https://www.rangevoting.org/NewAppo.html). But
it's not a big deal there: 0.495 vs 0.5 is a very small change. 0.3 vs
0.5, or 0.1 vs 0.5 is much more of a big deal.
(Then again, Droop proportionality spanning such a large space might
suggest otherwise. It's hard to tell.)
I'll probably backport some of the reimplementation to clean up my code,
and drop the "candidates also vote" aspect of the model (since in real
elections, the number of voters is so much larger than the number of
candidates that the latter effectively vanishes), and then post some new
plots. Eventually. I'm not going to risk burning myself out.
-km
[1] To test the "improper generalization" hypothesis, I tried to cluster
opinion space into mutually exclusive regions and then report the
fractions of voters/elected candidates falling into each region, instead
of the proportion holding a true opinion on each issue dimension. The
chi-squared test that the Sainte-Laguë index looks like requires mutual
exclusion. But that didn't change the outcome much, and it didn't push
the optimal argument closer to 0.5.